What should a social media analytics tool include?
So you’ve created a social media marketing strategy and now you’re ready to invest in a social media analytics tool. But what should you look for in a social media analytics tool?
In this piece, we explore the differences in manual vs. automated reporting, core features to look for in a social media analytics tool, and how you can put one to work for your brand.
Let’s dive in.
Article Table Of Contents
- Reports and ways to manually pull data
- Social media analytics Tools Should Include
- How you can use a social media analytics tool
Reports and ways to manually pull data
When you first think of compiling a social media analysis you may immediately reach for a simple report from each social platform. And that’s definitely an option. Social media platforms today offer their own analytics (we provide an overview and how-to breakdown of each platform here), and can give you a good level of insight into your brand’s performance.
Google Analytics is also a good supplementary source, providing tangible insights into your social media analytics. By taking a deep dive into Google Analytics’ reports, you can find out which social media platforms drive the most traffic to your website and understand metrics relating to landing pages, such as conversion rates.
To get a full picture of your social media data, however, you will either need to export each platform’s analytics report, consolidate the data, and pull the results into a single spreadsheet, or view each individual data report and determine your key findings from there.
But let’s be honest. Manual reporting processes like the ones just described are cumbersome, and because the data isn’t in one easy-to-view location, they often lead to missing important big picture insights that could help inform your marketing strategy and elevate your brand. Alternatively, an automated social media analytics tool is a quicker, more effective way to understand your social media performance, view it in a single location and make the necessary adjustments to reap ROI.
Social media analytics tools should include
The right social media analytics tool will work for your brand by consolidating data from your desired social media platforms, tracking customized metrics, providing multiple ways to view, understand, and share the data, and deliver instant insights that will empower your brand to make smarter marketing decisions.
Analysis of multiple social media channels
An analysis of multiple social media channels is a crucial factor to consider when looking at a social media analytics tool. Why, you ask? The core benefit of an overall analysis is that you can view your earned, organic, and paid social media analytics in one place. Rather than taking a singular approach to your social media analysis, you should be able to analyze conversations and comments across all platforms, including Facebook, Twitter, Instagram, TikTok, Reddit, LinkedIn, YouTube, and more.
A social media analytics tool can help you cut to the chase by instantly providing you with key takeaways from these platforms to further shape your marketing plan.
Dashboards and visualization
When it comes to consolidating data, a holistic social media dashboard is non-negotiable when picking the right analytics tool.
A 2021 report, The Forrester Tech Tide™: Enterprise Business Insights And Analytics, spoke to the importance of “single click” capabilities in leading enterprise Business Intelligence (BI) platforms, and making analytics accessible to a wider audience. “Not only do these [augmented BI] platforms turn business users into citizen data scientists; many also democratize valuable insights to the broader enterprise via a conversational user interface.”
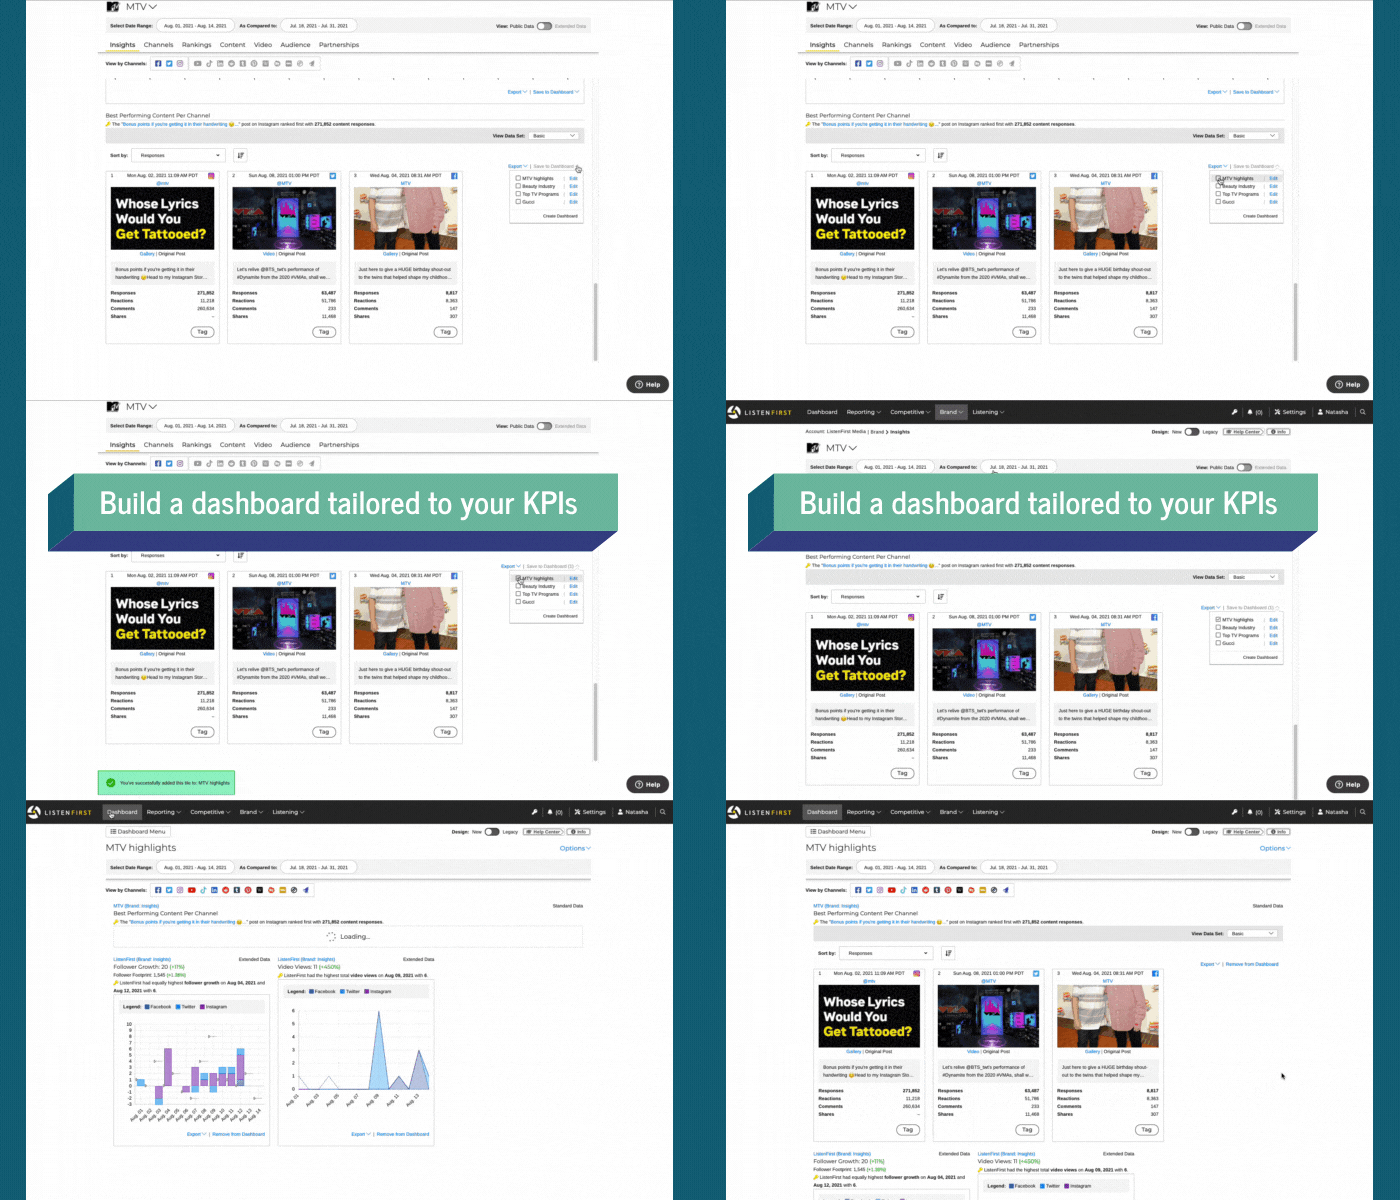
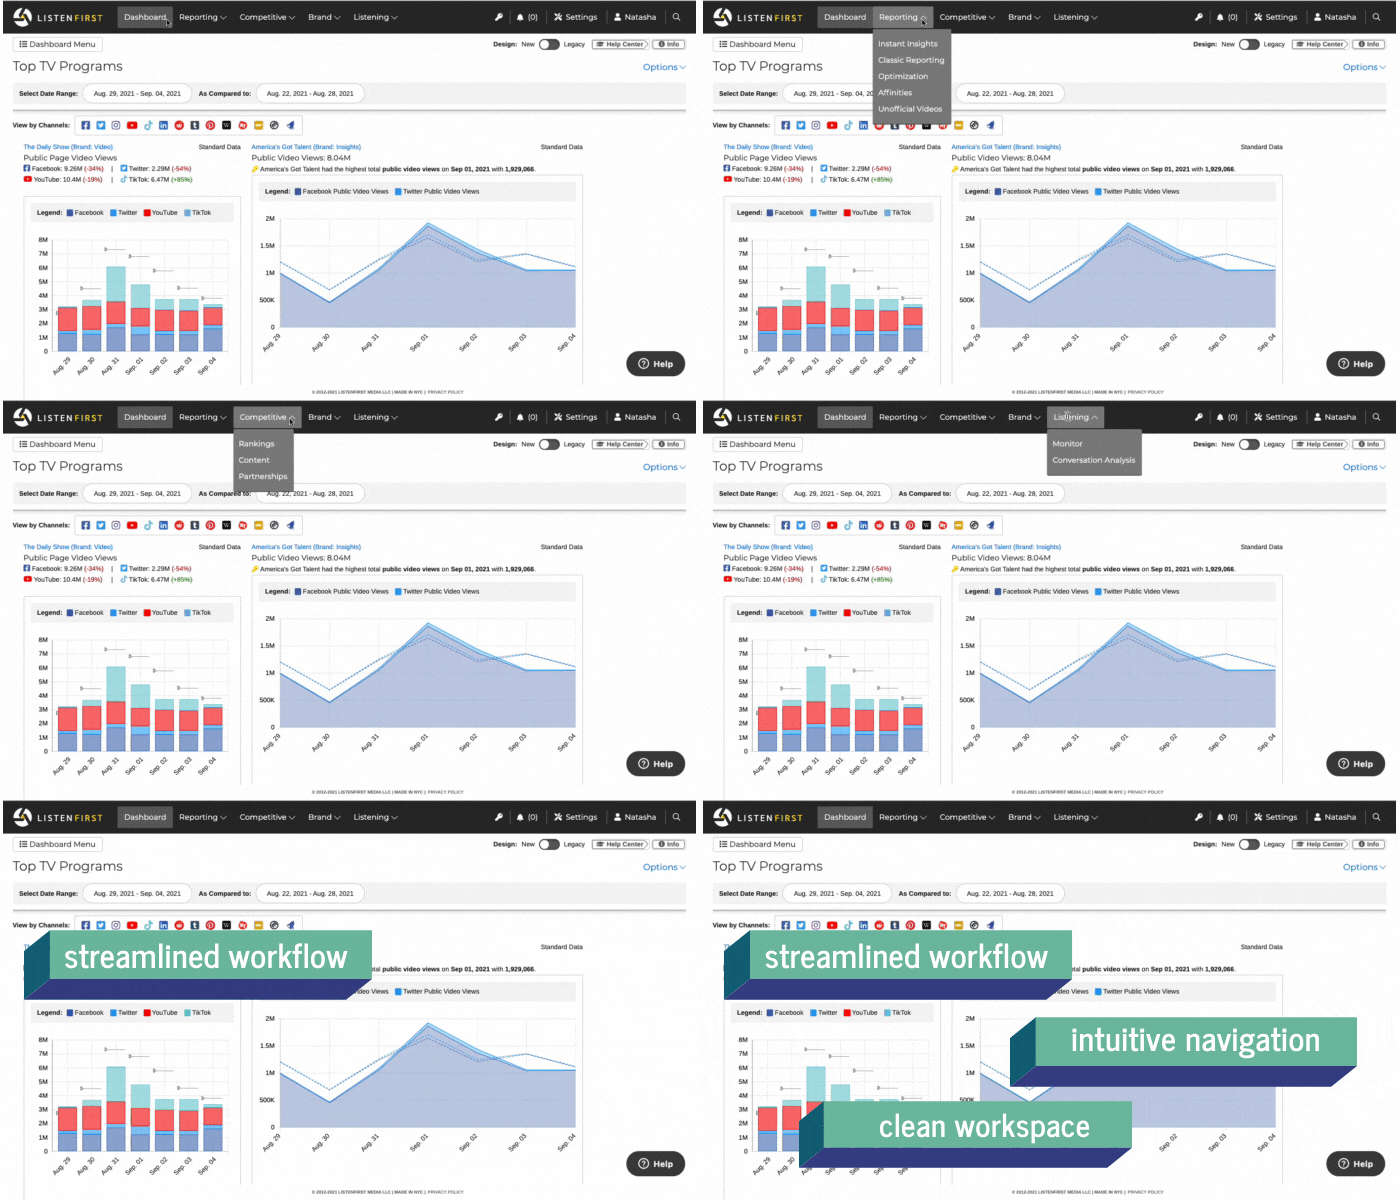
Keep this in mind when considering your social media analytics tool. A social media dashboard should allow you to create specific combinations of data to meet your team’s workflows. And data should be easy to see, intuitive to navigate, visualize, understand, and share.
Sentiment Analysis
Before the internet, customer feedback was usually conveyed over the phone or in brick and mortar stores. Today, the way your customers — and prospective customers — feel about your brand can be shared at any time of day via any social media platform or online review site. That’s why an important social media marketing goal for many brands is to positively change the way customers think and feel about their brand, or to enhance consumer sentiment.
A social media analytics tool should allow your brand to understand at scale, sentiment analysis and how the social media audience feels about your brand. This data can provide you with deep levels of consumer signals beyond just the positive, negative and neutral feeling. You should gain an understanding of trends around your brand or product so that you can better inform the content and tone of your social media campaign.
Emotion analysis and effort scoring
Building on sentiment analysis, it is also important to ask about emotion analysis and effort scoring when looking for your next social media analytics tool
The integration of emotional sentiment of earned social and comments on owned posts with organic and paid activity can supplement your sentiment analysis, giving you a fuller understanding of what your audiences care about and why, and provide important insights to change campaign strategies.
Around events, emotional sentiment can also challenge previous held assumptions and test how accurate they were. For example, around the Johnny Depp / Amber Heard defamation lawsuit, it was commonly assumed that the public became more negative towards Heard, as a result of the trial. However a ListenFirst analysis, found that the emotion of anger proportionally actually appeared less often in Tweets mentioning her after the trial began.
Meanwhile, Effort Score is a metric measuring customer satisfaction that a product or service is easy to use and is not data that can be collected from social media analytics tool. It requires customers to fill out a survey. After brand representatives resolve a customer issue that was brought up over social media, or responds to a social media request for information, email the customer an Effort Score survey to evaluate their satisfaction with the interaction.
Segmented data
An often overlooked feature when searching for a social media analytics tool is data segmentation. However, this simple ability can provide a deeper understanding of which tactics are driving audience interest. For example, when engagements and impressions of the same tweet are segmented by organic or promoted traffic, rather than lumped together, your brand gains clarity on how it’s connecting with audiences.
Understanding if impressions or engagements came from paid or organic traffic on a post is only possible through a social media analytics tool, if there’s the most up-to-date API integration. With the Twitter example, you’d need to make sure you have a solution that is using the v2 Twitter Engagement API.
Overlaying information across business areas
Data is just data, without the right insight. That’s why it’s important to ensure your social media analytics tool can layer social analytic insights with critical business data points from other sources.
That way, you can quickly and easily turn complex, multi-sourced data into easy-to-understand visualizations. Some social media analytics tools, like ListenFirst, have partnerships with Google Data Studio and Tableau, which make data visualization even easier to create and manage.
How you can use a social media analytics tool
So now that you know what to look for in a social media analytics tool, let’s talk about how we can put those capabilities to work for your brand.
Gather your social media statistics, operational data, and more
The social media tool you’ve chosen should enable you to tap into data from all available and relevant sources. This helps eliminate manual operations and dependence across teams, and ensures you can make better business decisions with the most complete information.
Set industry and business benchmarks
It’s a no-brainer. Benchmarking is critical to measuring the performance of social media campaigns (we outline four effective methods for doing so here). Set benchmarks within your social media analytics tool and monitor them regularly. This will lead you and your team to more engaging content and improved social ROI.
Start with your business goals. How do those translate into social metrics or outcomes? For example, when you want to grow awareness, consider metrics related to audience growth. Are you set on increasing brand affinity and loyalty? Review engagement rates. If improving brand reputation is the focus, use a proprietary metric like Brand Reputation Index or examine how social sentiment changes for your brand over time.
Download our report How to Maximize Social Media Analytics for more details on how to identify benchmarks that matter.
Generate a social media analytics report
Your social media analytics tool should have multiple reporting options. Whether you need to generate a report for a specific campaign, gather instant insights on a configurable social media dashboard, or see how you stack up to industry competitors, generating a social media analytics report will give you a great starting point to tracking your goals.
Set up reports that will allow you to see the most important metrics, including your benchmarks and historical trends, at a glance.
Search for trends and customer behavior
Your social media analytics report should provide an in-depth look at trends in social data and customer behavior. Use your reports to find key insights so you can act quickly and course correct when needed. Remember to compare pre- and post-campaign performance, because data with context means everything.
Take action to improve your social media performance
Your social media analytics tool should provide reports that are concise and actionable. Because one of the biggest benefits to reporting is the action you can take as a result.
Is your campaign engaging the right audience? For instance, if you’re trying to reach Generation Z with your social media posts, it would be important to know most of your followers are in the Generation X age group. Make changes if needed as you discover what inspires action. You can even focus on the elements such as color, product, talent or layout that perform best to create more fruitful campaigns.
Let the insights from your report help you optimize your messaging and visuals so your content always works to improve your performance.
Share and repeat your analysis
Once you have pulled your reports and measured against your goals, social media dashboards are a great way to communicate the story the data is telling to your key stakeholders. Your social media analytics tool should provide you with the ability to save analysis tiles to a shareable, configurable view, so that you can easily share your successes and lessons learned.
And finally, rinse, wash and repeat. One report or analysis is simply not enough. A social media marketing strategy, or social media campaign, must be measured regularly to ensure its success, with the ability to pivot at any point.
Try ListenFirst’s Social Media Analytics Solutions
Whether you’re just getting started or social media marketing veteran looking to upgrade your analytics, consider leveraging ListenFirst. Our centralized social media analytics solution makes analyzing paid, owned, and earned content across all social media platforms easy. Decide what insights matter most, we’ll configure it and export the comprehensive social media reports you crave.
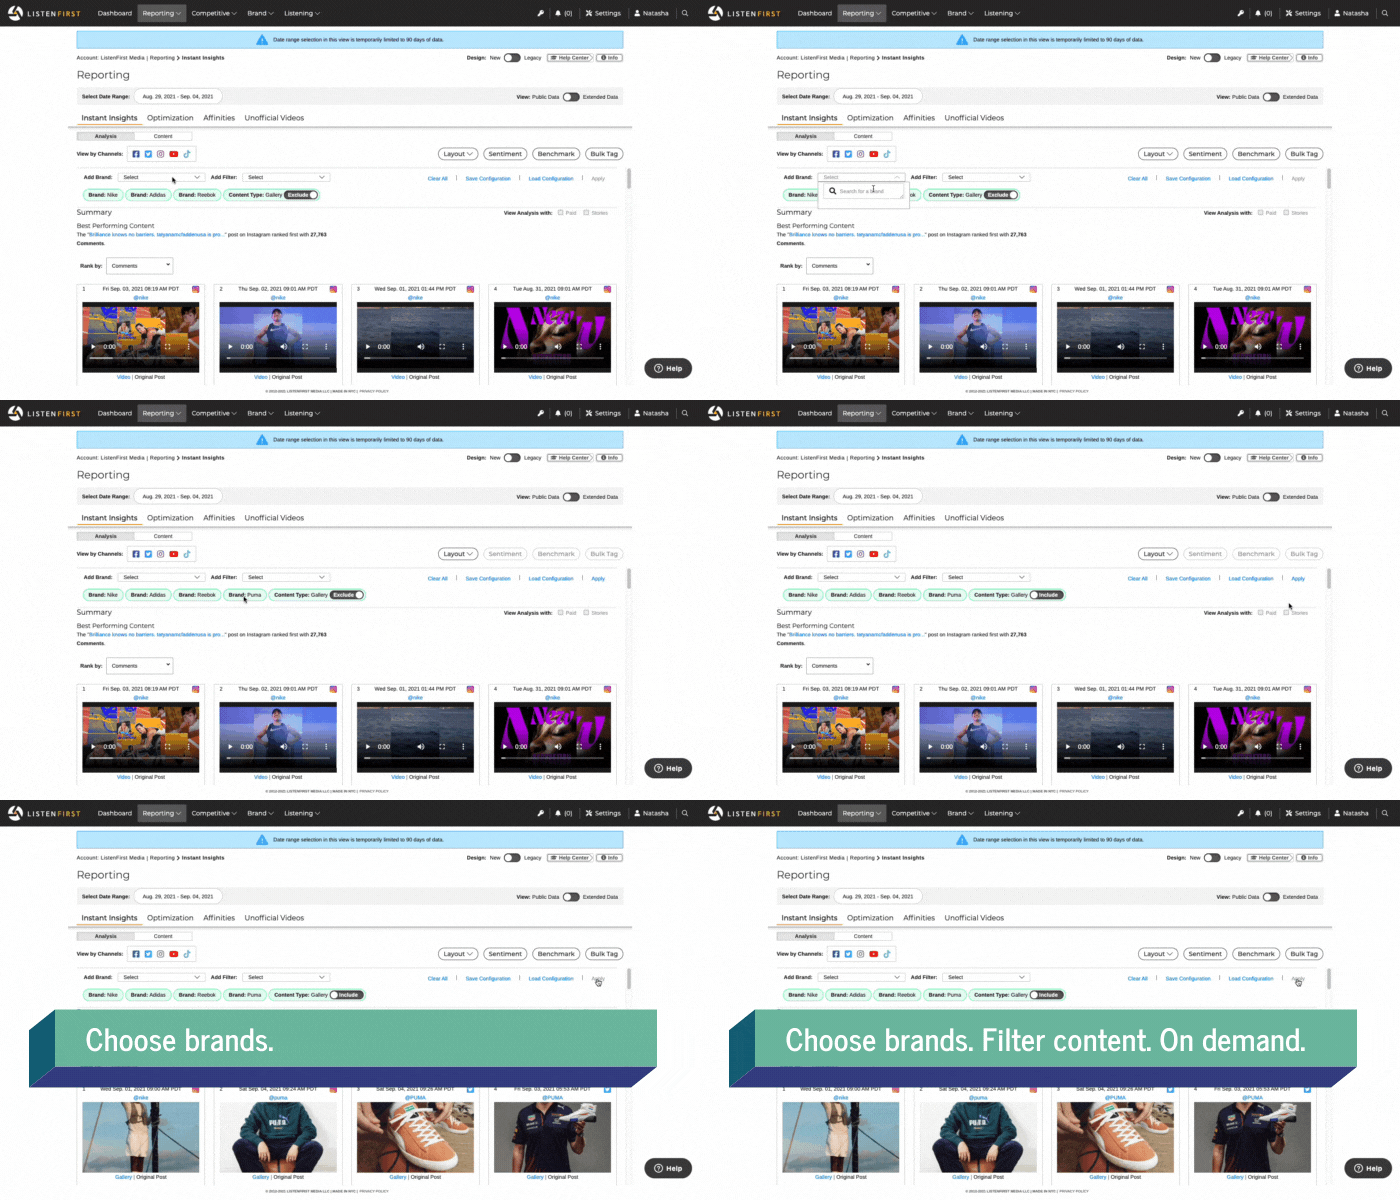
In addition to providing a centralized platform, ListenFirst helps you quickly understand key takeaways that are meaningful to you with Instant Insights, a single-click feature that leverages machine learning for easy access.
And while some say comparison is the thief of joy, when it comes to social media, it’s the opposite. ListenFirst reviews your brand’s performance across various social media platforms to provide analytics that support apples-to-apples comparison. You can review analytics at the enterprise, brand, product, and individual-post level.
Lastly, context is everything. ListenFirst’s social listening capabilities provide insights around a topic, brand, or product. Measure cross-platform trends and shifts in viewing habits over time to find out what works, what doesn’t, and why. A sentiment analysis helps you understand how your audience feels towards a topic or theme. So you can use those insights to tailor content, plan campaign strategies, and allocate spend.
Ready to uncover key takeaways, put insights into action, and easily share findings with your team? Try your free ListenFirst demo today.


